Correspondent Banking Fee Structures for Emerging Market Corridors
Hidden fees across correspondent banks can cost emerging markets eight percent or more per transfer.
Correspondent banking fees for emerging market corridors aren't a single charge. They're a stack: SWIFT messaging fees, per-hop lifting deductions, FX spreads baked into the exchange rate, and the invisible cost of capital sitting idle in nostro accounts. Most finance teams budget for the first item on that list and get blindsided by the other three, because nobody itemizes the whole chain up front. This piece walks through each layer, what drives it, and where a business actually has room to push back.
Global cross-border payments revenue reached trillions of dollars in 2024. A relatively small share of that is interest income or lending margin; most of it is fees and spreads, and a disproportionate share gets extracted from smaller counterparties moving money through emerging market corridors, where the chain is longest and the competition is thinnest.
How the correspondent banking chain is structured and why emerging corridors run longer
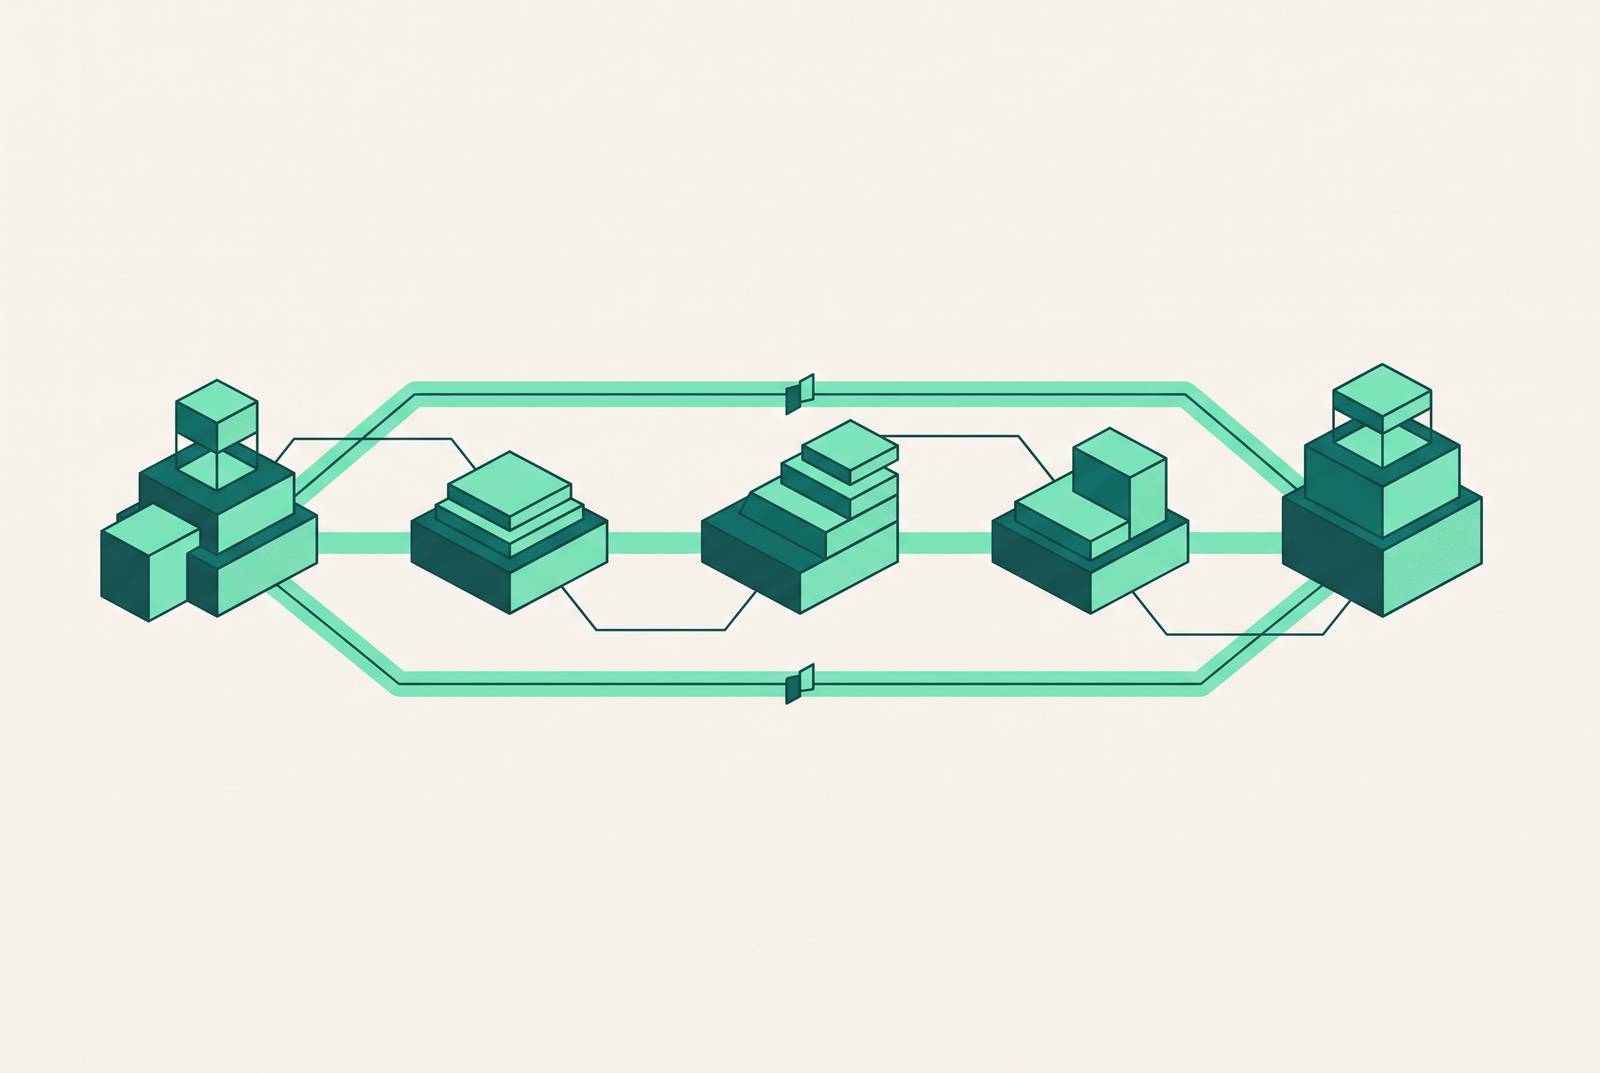
Here's the basic wiring. A sending bank that has no direct account relationship with the receiving bank has to route the payment through a correspondent, a bank that holds accounts on behalf of both parties, or close to it. In the US-to-Germany direction, that's often a single hop. In a payment from, say, a mid-sized exporter in Kenya to a buyer in Vietnam, that's rarely a single hop. It usually needs a hub correspondent (a large US, European, or regional bank sitting in the middle) plus a sub-correspondent inside the receiving country to actually get the money to a local account.
Every one of those additional links is a cost point and a delay point. That's less a design flaw than the physical shape of a network that grew organically instead of being built from scratch for these routes.
The concentration is the part worth sitting with. A small number of correspondent banks now process the large majority of global cross-border payment value, a share that has grown over the past decade. Meanwhile, active correspondent banking relationships fell significantly between 2011 and 2022, with the sharpest drops concentrated in developing economies. Pacific Island nations lost a substantial share of their relationships; the Caribbean saw similarly steep losses over the same period.
Put those two numbers together and the picture gets uncomfortable fast. More volume is funneling through fewer banks, and the corridors that had the fewest alternatives to begin with are the ones that lost the most. Less competition on any given path means less pressure on anyone to price that path fairly: when there's one bridge left over the river, the toll goes up.
Lifting fees: the per-hop deductions that accumulate silently
A lifting fee is what each correspondent bank charges for processing and forwarding the payment instruction, and it's typically deducted straight from the principal before the money moves on to the next bank in line. Nobody calls ahead to warn the sender. The beneficiary just receives less than the invoice said, with no itemized breakdown explaining where the shortfall went.
Each hop carries its own processing charge, typically a modest but non-trivial flat fee. That sounds trivial until multiplied out. A two-hop emerging market corridor means two separate deductions, and that's before accounting for failed payments, which affect a meaningful share of first attempts into these markets, usually because of a mismatched beneficiary field, a compliance hold, or a local bank quirk nobody flagged in advance. A failed payment restarts the fee cycle from scratch. Finance teams then burn real hours each month reconciling status across separate bank portals that don't talk to each other, which adds its own overhead to the process.
Speed compounds the cost further. Traditional cross-border B2B payments can take several business days on average through correspondent banking, and that float window is dead capital, earning nothing while it sits. On significant annual cross-border volume, the combination of lifting fees, failed payment costs, and reconciliation overhead can add up to a material sum. That's not a rounding error on a budget line; that's a headcount.
SWIFT's GPI tracking system has genuinely helped visibility, with payments on GPI-enabled routes processing significantly faster than legacy alternatives, though with wide variance by route, and the gap between GPI-enabled corridors and legacy ones is exactly where emerging markets tend to fall. Better tracking doesn't change the condition of the underlying road.
FX spreads: the cost layer that hides inside the exchange rate
This is the one that hides in plain sight. A correspondent quotes an exchange rate that includes a markup over the interbank mid-rate, and that markup is pure margin, never disclosed as a line-item fee because it doesn't need to be; it's just baked into the number on the screen.
Emerging market currencies draw wider spreads for reasons that are structural rather than punitive. Local currency markets are thinner, so hedging costs more for whoever's holding the risk. Volatility means correspondents need bigger buffers to manage exposure during the day. And fewer market makers means less competition pushing the rate toward fair value.
The compounding problem shows up on multi-hop payments: if two or three correspondents each perform their own currency conversion along the route, the FX margin can get charged more than once on the same transfer.
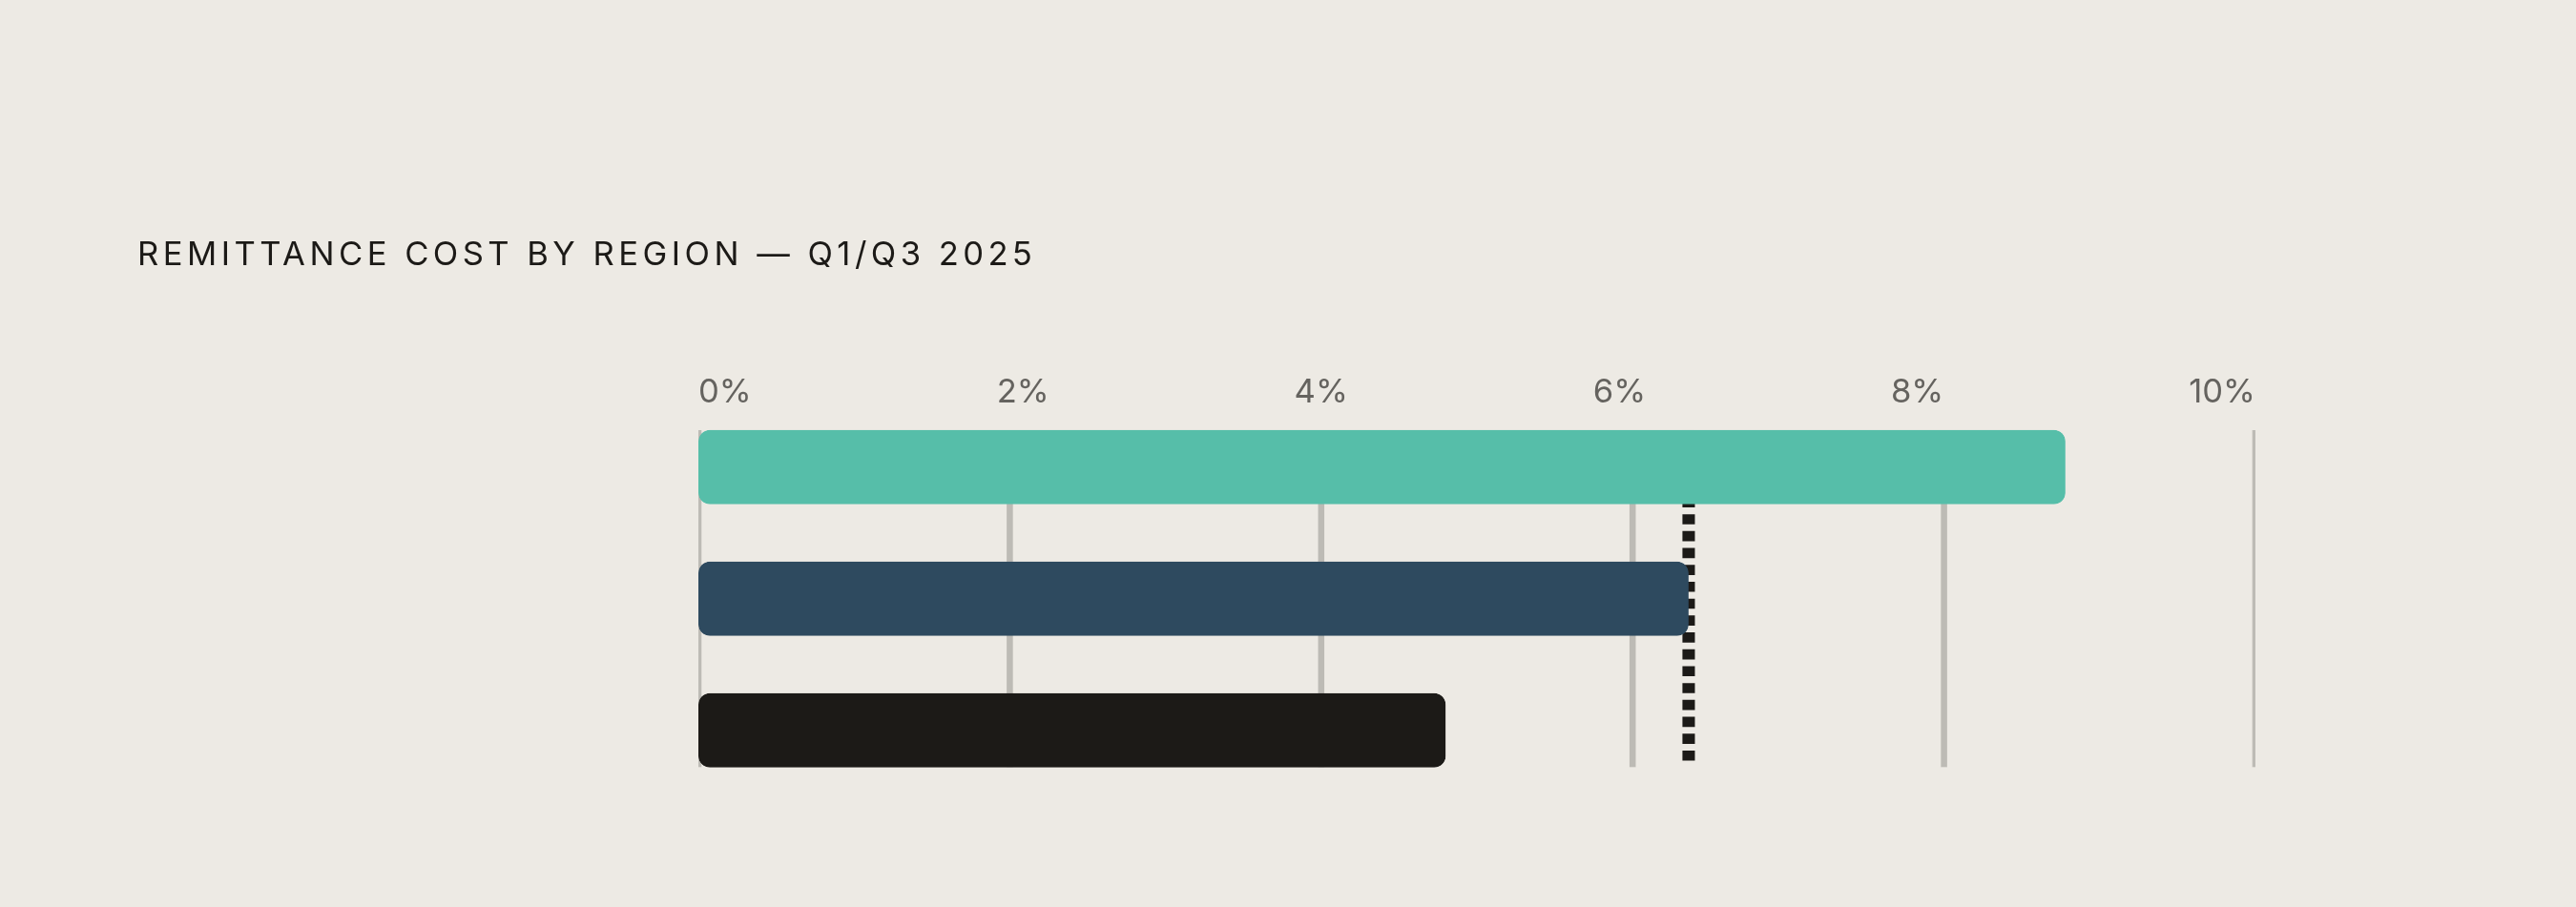
World Bank remittance data puts the global average cost at 6.36% in Q3 2025, but that blended number hides the real spread. Sub-Saharan Africa averaged 8.78% in Q3 2025, among the most expensive receiving regions tracked. South Asia averaged 4.80% in Q1 2025, the lowest-cost region, a gap that reflects deeper currency liquidity and a more competitive provider base rather than any inherent difference in the money itself.
Banks averaged a 14.99% total cost in Q3 2025 compared with 3.54% for digital-only money transfer operators. Much of that gap lives inside the FX margin, not the disclosed fee. The mid-rate is public and free to look up on Reuters or Bloomberg, yet many businesses still accept a quote without checking it first, largely out of inertia. Sourcing the interbank rate independently before each transaction isn't advanced treasury strategy; it's baseline homework.
Nostro and vostro accounts: the liquidity cost no one invoices
To actually execute a payment in a foreign currency, a bank needs pre-funded balances sitting in accounts at its correspondents. Those are called nostro accounts ("ours," held abroad); the mirror version, where a correspondent holds a foreign bank's balance, is a vostro account ("yours," held here). Either way, it's money parked and waiting, doing nothing except being available.
That's the opportunity cost nobody invoices for. Every dollar sitting in a nostro account is a dollar that isn't out earning interest, funding a loan, or covering working capital somewhere else. Estimates of global nostro balances held at major correspondent banks range from $400 billion to over $1 trillion; broader estimates, including McKinsey figures that account for a wider scope, run past $10 trillion depending on methodology. Even taking the conservative end of that range, it's an enormous amount of capital sitting still.
At the institution level, a top-30 global bank might hold $10 billion to $25 billion in nostro balances spread across its correspondent network, and a recent study found the average annual maintenance cost of nostro accounts for surveyed banks reached $1.5 million. None of that shows up as a named charge on any invoice. It gets priced into the correspondent fee and the FX spread instead, folded into the headline rate so quietly that it's structurally invisible unless someone goes looking for it.
The knock-on effect for emerging markets is direct: smaller local banks can't maintain the minimum balances that large correspondents require to make the relationship worthwhile. That's accelerated the decline in correspondent relationships across developing economies, and the banks losing access are, predictably, the ones serving the smaller-volume, higher-cost corridors where an alternative route is needed most.
Compliance overhead and de-risking: how AML costs become a fee on entire corridors
Large correspondent banks run a fairly cold calculation on AML, KYC, and customer due diligence: if the compliance cost of maintaining a relationship exceeds the revenue it brings in, the relationship gets cut. That's de-risking, and it's less a matter of any single bank being flagged as suspicious than a cost-to-volume ratio problem.
The relationships shed first tend to belong to smaller banks in jurisdictions classified as higher-risk: parts of Africa, the Caribbean, Pacific Islands, Eastern Europe. Not because those banks are non-compliant, necessarily, but because the cost of verifying them properly is high relative to what the relationship generates. Over 60% of banks across surveyed regions cited external compliance impediments to correspondent relationships, and in Sub-Saharan Africa specifically, more than 80% of banks reported that impact, according to IFC survey data.
Here's the irony worth sitting with: de-risking, done in the name of stopping money laundering, tends to concentrate the remaining correspondents, reduce competition, and push some payment flows toward informal or unmonitored channels, exactly the outcome AML policy is supposed to prevent. Fewer compliant routes means higher fees on whatever routes survive, and some of the volume that gets squeezed out doesn't disappear; it just goes somewhere with less oversight.
The World Bank took this seriously enough to launch a $77 million initiative in 2024 across eight Pacific Island countries, aimed specifically at preserving the correspondent banking connections those countries had left. That's a multilateral institution spending real money to stop a fee-generating financial system from quietly collapsing under its own compliance weight. For a business moving payments through one of these corridors, none of this shows up as a line item labeled "compliance." It shows up as a pricing premium, or worse, as a corridor that simply isn't available anymore.
What the cost gap between banks and non-bank providers reveals about the fee stack
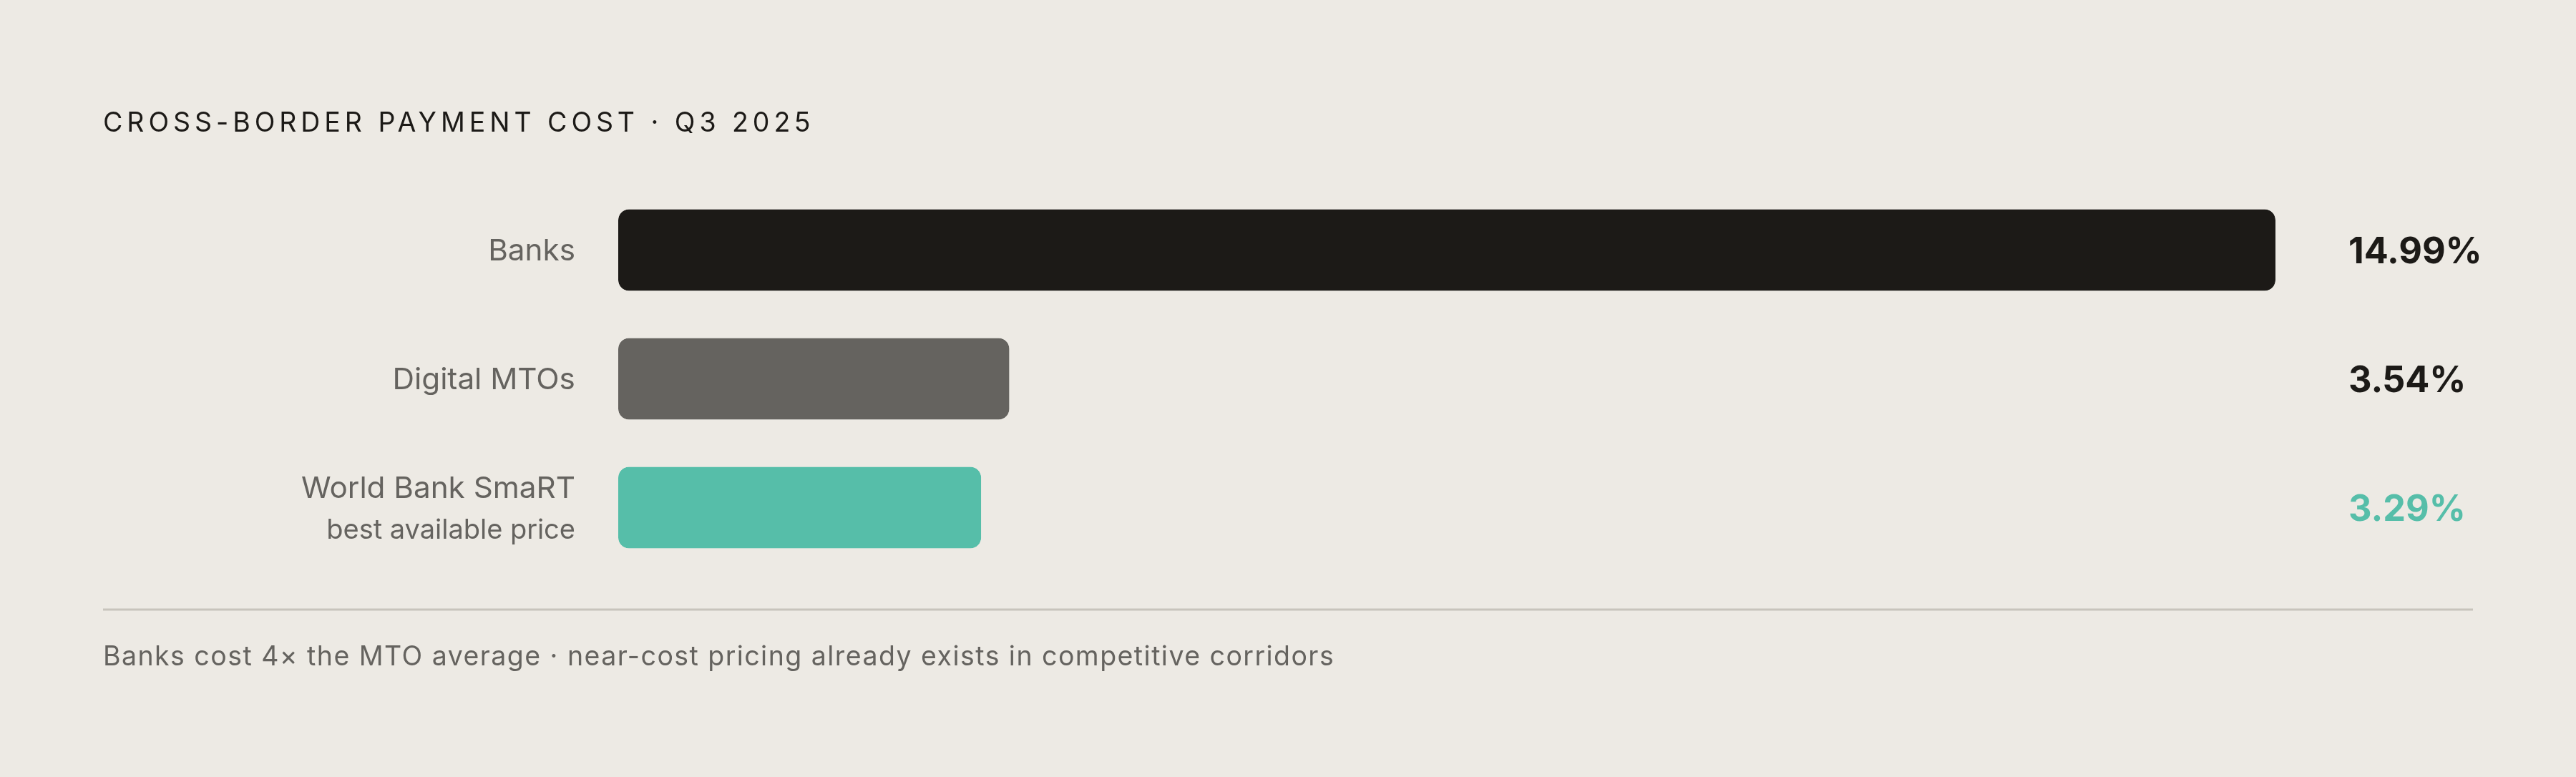
Put the numbers side by side: banks averaged 14.99% total cost in Q3 2025; digital-only money transfer operators averaged 3.54%. That's roughly a fourfold difference, and it reflects a differently built cost structure rather than corner-cutting by MTOs.
MTOs generally hold fewer nostro relationships and use pre-funded accounts more efficiently at scale. Many route through fewer intermediary hops by building direct integrations into local payment rails instead of relying on a chain of correspondents. FX gets handled at tighter spreads because volume is aggregated, and compliance infrastructure is built for the specific corridors served rather than spread thin across thousands of relationships worldwide.
The World Bank's Global SmaRT Average, the lowest price actually available in each corridor, sat at 3.29% in Q3 2025. That's the proof point: near-cost pricing exists in plenty of corridors when a competitive provider shows up. Banks still hold real advantages in credit quality, counterparty trust for large B2B transactions, and regulatory standing for certain payment types. The practical takeaway is knowing what's actually available before assuming the bank quote is the market rate.
The trend line is moving in one direction. Across the four largest US outbound corridors, average digital MTO pricing dropped from 4.4% in 2017 to 2018 down to 3.6% in 2024, per William Blair data. And the corridor-specific gap holds: South Asia's 4.80% average reflects dense MTO competition, while Sub-Saharan Africa's 8.78% reflects corridors where even digital providers still run into liquidity and compliance walls. Competition helps, but it can't fix a corridor that has no liquidity to begin with.
How to read a corridor's fee stack before committing to a payment route
Start with the benchmark. The World Bank's Remittance Prices Worldwide database covers a wide range of corridors, and looking up both the average and the best-available price for a specific route gives a real sense of what the market actually charges.
Then decompose the quote itself. Ask for the independent mid-market rate and compare it to what's being offered; the gap is the FX spread, in plain sight once measured against something external. Ask how many correspondents the payment passes through, and confirm whether the fee code is SHA (costs shared between sender and receiver), OUR (sender covers everything), or BEN (beneficiary absorbs it), since that single instruction determines where the lifting fees actually land. And ask for a total cost of transaction figure, not just the sender-side fee, because the sender-side fee is often the smallest number in the stack.
The nostro layer is harder to see directly, but settlement time works as a rough proxy: a bank with a thin correspondent network in a specific country either charges a premium or routes through an extra hop, and both show up as delay. Mapping compliance flags matters too. Corridors classified as higher-risk by FATF, or currently experiencing active de-risking, will have fewer competitive routes on offer, which signals elevated fees regardless of which provider is chosen.
Even the payment instrument itself is a cost lever. Credit or debit card as a sending instrument averaged 4.39% in Q3 2025, while debit card as a receiving instrument averaged 3.61%, per World Bank data. Instrument choice is a variable, not a fixed cost. And for genuinely high-volume corridors, high-volume corridors with strong competitive dynamics show what's possible whenment policy absorbs the cost entirely; knowing whether a sovereign incentive operates in a given corridor changes the entire negotiation baseline before a single quote gets requested.
Where businesses have room to negotiate or reroute, and where structural costs are fixed
Some of this stack bends. Correspondent markup above the base lifting fee can compress with volume commitments. FX spreads can tighten for businesses with enough regular flow to justify an interbank-pegged rate instead of a retail one. The SHA-versus-OUR fee instruction can often be specified transaction by transaction, which at minimum determines who eats the surprise deduction.
Other parts of the stack move less, regardless of negotiation skill. Nostro liquidity costs are embedded system-wide; a business absorbs them through the rate, never through a line item it can dispute. Compliance overhead in a de-risked corridor is set by the regulatory environment itself; no volume discount changes what a bank has to spend verifying a counterparty in a high-risk jurisdiction. And if correspondent relationships have already been shed between two specific countries, rerouting through a third country might be the only path left, which adds a hop and a cost rather than removing one.
Route selection matters most exactly where correspondent coverage is thinnest, in the Pacific Islands, in parts of Sub-Saharan Africa, where non-bank rails, local real-time payment systems, or purpose-built corridor platforms can bypass the correspondent chain altogether rather than trying to negotiate a better price within it.
Businesses that treat correspondent banking as a procurement category, benchmarking corridor costs against the World Bank data, decomposing every quote into its four layers, and tracking which routes are structurally fixed versus which ones flex with volume, end up with a real budget instead of a guess. The fee stack was never one number, and treating it like one is how the mid-chain surprises keep happening.